Listen to this Post
Introduction:
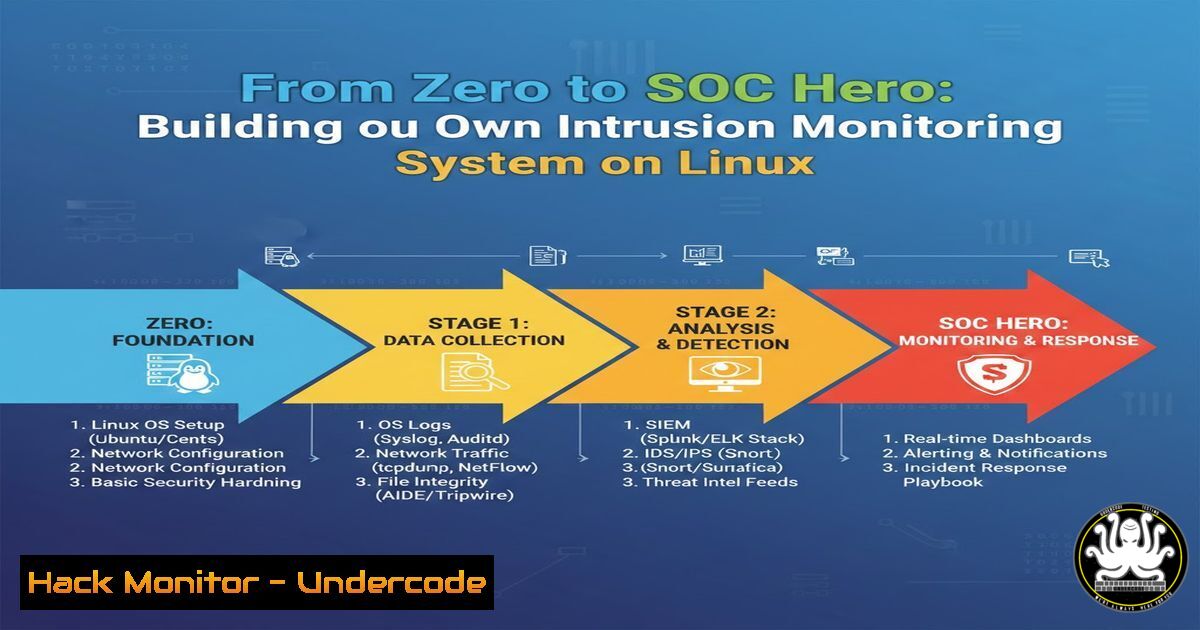
In today’s threat landscape, acting as a Security Operations Center (SOC) analyst by building a custom intrusion monitoring system on Linux is a critical hands-on skill. This article delves into implementing centralized logging, automated IP banning, and attack pattern analysis to detect and respond to real-world threats like brute-force attacks, WordPress probing, and DDoS attempts. By emulating a SOC environment, you’ll gain practical insights into security monitoring, from detection to incident documentation.
Learning Objectives:
- Set up centralized log monitoring for SSH, web servers, Docker, and databases like MSSQL.
- Configure Fail2Ban to automatically block malicious IPs across multiple services.
- Analyze attack patterns and perform Geo-IP analysis for enhanced threat intelligence.
You Should Know:
1. Centralizing Logs with Rsyslog and Logstash
Centralized logging aggregates data from various sources (e.g., SSH, nginx, Docker) for easier analysis. Use Rsyslog for log collection and Logstash for parsing and forwarding to a SIEM like Elasticsearch.
Step‑by‑step guide:
- Install Rsyslog on Linux: `sudo apt-get install rsyslog` (Debian/Ubuntu) or `sudo yum install rsyslog` (RHEL/CentOS).
- Configure Rsyslog to receive logs from remote clients by editing
/etc/rsyslog.conf:Enable UDP/TCP log reception module(load="imudp") input(type="imudp" port="514") module(load="imtcp") input(type="imtcp" port="514")
- For structured analysis, install Logstash (part of the ELK stack) and create a configuration file to filter logs, e.g., for SSH failures:
filter { if [bash] == "sshd" { grok { match => { "message" => "%{SYSLOGTIMESTAMP:timestamp} %{SYSLOGHOST:hostname} sshd[%{POSINT:pid}]: %{LOGLEVEL:loglevel} %{GREEDYDATA:message}" } } } } - Start services: `sudo systemctl restart rsyslog` and
sudo systemctl start logstash. This setup ensures all logs are stored centrally, enabling quick search and correlation during incidents.
2. Configuring Fail2Ban for Multi-Service Protection
Fail2Ban scans log files for patterns like repeated failed login attempts and bans IPs using iptables or firewalld. It supports jails for SSH, nginx, and custom services.
Step‑by‑step guide:
- Install Fail2Ban: `sudo apt-get install fail2ban` or
sudo yum install fail2ban. - Copy the default config:
sudo cp /etc/fail2ban/jail.conf /etc/fail2ban/jail.local. - Edit `/etc/fail2ban/jail.local` to enable jails. For SSH protection:
[bash]
enabled = true
port = ssh
filter = sshd
logpath = /var/log/auth.log
maxretry = 3
bantime = 3600
- For nginx brute-force protection, create a filter file
/etc/fail2ban/filter.d/nginx-http-auth.conf:[bash] failregex = ^ [error] \d+\d+: \d+ user "\S+":? (password mismatch|was not found), client: <HOST>, server: \S+, request: "\S+ \S+ HTTP/\d+.\d+", host: "\S+"\s$
- Add a jail for nginx in
jail.local:[nginx-http-auth] enabled = true port = http,https filter = nginx-http-auth logpath = /var/log/nginx/error.log
- For recidive (repeat offenders) and DDoS jails, use the built-in filters and set longer bantimes. Restart Fail2Ban:
sudo systemctl restart fail2ban. Monitor bans withsudo fail2ban-client status sshd.
3. Detecting and Analyzing Web Attacks (WordPress, PHP)
Attackers often scan for vulnerabilities in web applications like WordPress by probing `/wp-admin` or random PHP files. Use log analysis tools like GoAccess or custom scripts to identify patterns.
Step‑by‑step guide:
- Configure nginx or Apache to log access attempts in a structured format (e.g., JSON). For nginx, edit
/etc/nginx/nginx.conf:log_format json_analysis escape=json '{ "time": "$time_local", "remote_ip": "$remote_addr", "request": "$request", "status": "$status", "user_agent": "$http_user_agent" }'; access_log /var/log/nginx/access.log json_analysis; - Use `grep` and `awk` to scan for suspicious requests:
grep -E "(wp-admin|wp-content|.php)" /var/log/nginx/access.log | awk '{print $1}' | sort | uniq -c | sort -nr - Set up a Python script to parse logs and alert on thresholds, e.g., more than 10 requests to PHP files per minute:
import re from collections import Counter log_file = '/var/log/nginx/access.log' with open(log_file, 'r') as f: logs = f.readlines() ip_counter = Counter() for line in logs: if re.search(r'.php|wp-admin', line): ip = re.findall(r'(\d+.\d+.\d+.\d+)', line)[bash] ip_counter[bash] += 1 for ip, count in ip_counter.most_common(5): if count > 10: print(f"Alert: {ip} scanned {count} PHP/WordPress pages") - Integrate with Fail2Ban by creating a custom filter for WordPress probes, then ban IPs automatically.
4. Implementing Geo-IP Analysis for Attacker Attribution
Geo-IP analysis maps IP addresses to countries and ISPs, helping identify attack sources. Use tools like `geoipupdate` and databases from MaxMind.
Step‑by‑step guide:
- Install the GeoIP database: `sudo apt-get install geoip-database` or download from MaxMind.
- Use `mmdblookup` to query IPs. First, install
libmaxminddb:sudo apt-get install libmaxminddb-dev. - Create a script to extract IPs from logs and get Geo data:
Extract IPs from SSH failed logs grep "Failed password" /var/log/auth.log | awk '{print $11}' | sort -u > /tmp/ips.txt while read ip; do country=$(mmdblookup -f /usr/share/GeoIP/GeoLite2-Country.mmdb -i "$ip" country names en 2>/dev/null | grep -oP '"\K[^"]+') echo "$ip: $country" done < /tmp/ips.txt - For automated reporting, use Python with the `geoip2` library:
pip install geoip2. Then, in a script:import geoip2.database reader = geoip2.database.Reader('/path/to/GeoLite2-Country.mmdb') response = reader.country('8.8.8.8') print(response.country.name) - Correlate this data with attack logs to identify high-risk regions and adjust firewall rules accordingly.
5. Setting Up Real-Time Alerts and Daily Reports
Real-time alerts via tools like `swatch` or `Prometheus` coupled with daily report scripts ensure timely incident response.
Step‑by‑step guide:
- Install `swatch` for log watching:
sudo apt-get install swatch. - Create a configuration file `~/.swatchrc` to monitor SSH failures:
watchfor /Failed password/
echo red
exec "echo 'SSH failure detected on $HOSTNAME' | mail -s 'Alert' [email protected]"
- Run swatch:
swatch --config-file=~/.swatchrc --tail-file=/var/log/auth.log. - For daily summaries, write a cron job that runs a script at midnight:
!/bin/bash
report_file="/var/log/security_report_$(date +%Y%m%d).txt"
echo "Daily Security Report" > $report_file
echo "=====================" >> $report_file
grep "Ban" /var/log/fail2ban.log | wc -l >> $report_file
echo "IPs banned today." >> $report_file
Add Geo-IP summary
/path/to/geoip_script.sh >> $report_file
mail -s "Daily Security Report" [email protected] < $report_file
- Schedule it with
crontab -e:0 0 /path/to/daily_report.sh. This provides visibility into attack trends and SOC performance.
6. Hardening SSH and MSSQL Services
Securing services like SSH and MSSQL reduces attack surfaces. Use key-based authentication, change ports, and implement network controls.
Step‑by‑step guide:
- For SSH, disable password authentication and use keys. Edit
/etc/ssh/sshd_config:PasswordAuthentication no PubkeyAuthentication yes PermitRootLogin no Port 2222 Change default port
- Restart SSH:
sudo systemctl restart sshd. On Windows for MSSQL, use SQL Server Configuration Manager to disable unnecessary protocols and enable encryption. - On Linux for MSSQL (if using Docker), ensure strong passwords and network isolation:
docker run -e 'ACCEPT_EULA=Y' -e 'SA_PASSWORD=StrongPass!2024' -p 1433:1433 --name mssql -d mcr.microsoft.com/mssql/server:2019-latest
- Use firewall rules to restrict access: `sudo ufw allow from 192.168.1.0/24 to any port 2222` (SSH) and `sudo ufw allow from trusted_ip to any port 1433` (MSSQL).
- Monitor logs with Fail2Ban by creating a custom filter for MSSQL failed logins in
/etc/fail2ban/filter.d/mssql.conf.
7. Automating Incident Logs and Snapshots
Automating log archiving and system snapshots ensures data preservation for forensics and compliance. Use tar, rsync, and cloud storage.
Step‑by‑step guide:
- Create a script to take daily snapshots of critical logs:
!/bin/bash
backup_dir="/backup/security_logs"
mkdir -p $backup_dir
tar -czf "$backup_dir/logs_$(date +%Y%m%d).tar.gz" /var/log/auth.log /var/log/nginx/access.log /var/log/fail2ban.log 2>/dev/null
Use rsync to offsite backup
rsync -avz $backup_dir/ user@remote-server:/backup/
Cleanup old backups (older than 30 days)
find $backup_dir -type f -mtime +30 -delete
- Schedule it with cron:
0 1 /path/to/backup_script.sh. - For incident logging, integrate with a ticketing system like Jira or use a simple database. A Python script can parse Fail2Ban logs and insert into SQLite:
import sqlite3, re conn = sqlite3.connect('/var/lib/incidents.db') c = conn.cursor() c.execute('''CREATE TABLE IF NOT EXISTS incidents (ip TEXT, date TEXT, service TEXT)''') with open('/var/log/fail2ban.log', 'r') as f: for line in f: if 'Ban' in line: ip = re.findall(r'(\d+.\d+.\d+.\d+)', line)[bash] date = re.findall(r'\d{4}-\d{2}-\d{2}', line)[bash] c.execute("INSERT INTO incidents VALUES (?, ?, 'ssh')", (ip, date)) conn.commit() conn.close() - This automation streamlines SOC workflows and aids in post-incident analysis.
What Undercode Say:
- Key Takeaway 1: Hands-on intrusion monitoring builds critical SOC skills that theory alone cannot provide, emphasizing the value of real-world log analysis and automation.
- Key Takeaway 2: Centralized logging coupled with tools like Fail2Ban and Geo-IP analysis transforms raw data into actionable intelligence, enabling proactive threat hunting and response.
Analysis: The post underscores a shift toward DIY security operations, where professionals emulate enterprise SOCs using open-source tools. This approach not only enhances technical prowess but also fosters a mindset of continuous monitoring and adaptation. By documenting everything from brute-force attempts to DDoS patterns, practitioners develop a nuanced understanding of attack vectors, which is essential for career growth in cybersecurity. The integration of automation reduces manual overhead, allowing focus on strategic analysis—a key trend in modern security teams.
Prediction:
The future of SOC roles will increasingly blend AI-driven anomaly detection with hands-on custom monitoring systems. As attacks evolve in sophistication, leveraging machine learning for pattern recognition in logs (e.g., via TensorFlow or Splunk) will become standard, while cloud-based SIEMs will offer scalable solutions for small teams. However, the core principles of log centralization, automated response, and threat intelligence sharing will remain vital, with professionals who master these skills leading incident response in hybrid environments. Expect a rise in integrated platforms that combine Geo-IP, behavioral analytics, and real-time reporting, making DIY SOC setups more accessible but also demanding higher expertise in configuration and analysis.
▶️ Related Video (82% Match):
🎯Let’s Practice For Free:
IT/Security Reporter URL:
Reported By: Ibrahim Husi%C4%87 – Hackers Feeds
Extra Hub: Undercode MoN
Basic Verification: Pass ✅


