Listen to this Post
Introduction:
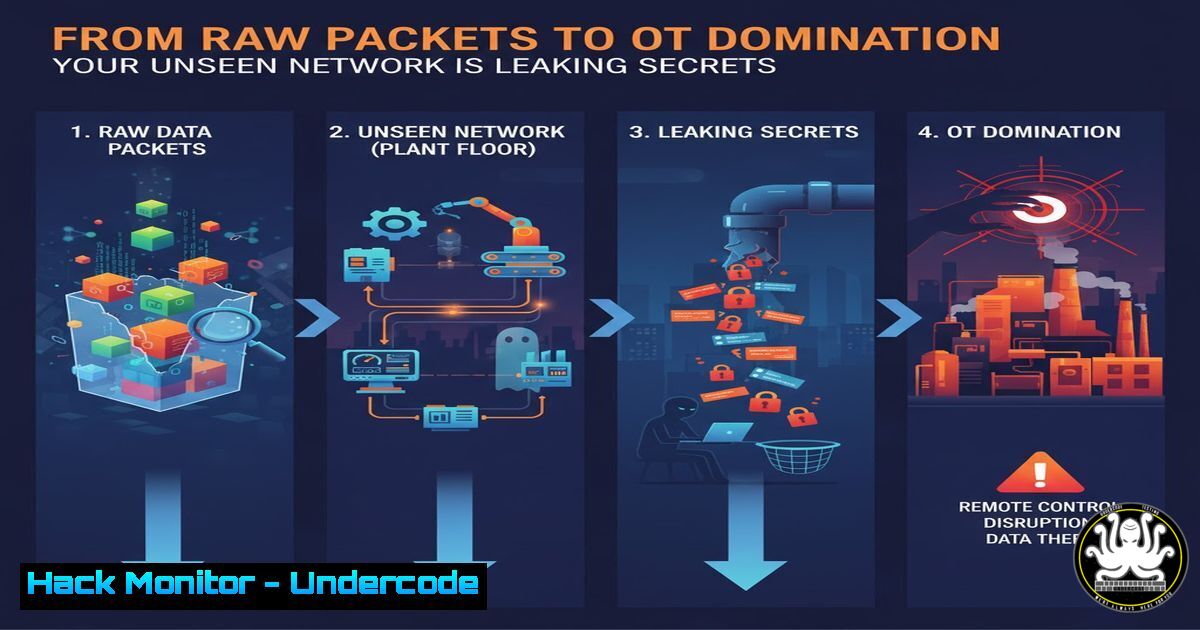
In the high-stakes world of Operational Technology (OT) security, visibility is not just an advantage—it’s a necessity for survival. The journey from raw network packets to actionable events in an OT SIEM begins with a foundational yet often misunderstood process: network mirroring via SPAN ports. This technique is the critical first step in transforming the invisible chatter of PLCs and SCADA systems into a structured narrative of your industrial environment’s health and security.
Learning Objectives:
- Master the configuration of SPAN/mirror ports on common enterprise and industrial network equipment.
- Acquire and analyze Packet Capture (PCAP) files to identify OT-specific protocols and potential threats.
- Transform raw packet data into structured, query-ready logs for ingestion into a security analytics platform.
You Should Know:
1. Configuring a Cisco Switch for SPAN
Network Traffic Mirroring is the cornerstone of passive network monitoring. It allows you to copy packets from source ports or VLANs to a destination port without impacting the original network traffic. This is essential for deploying intrusion detection systems and packet capture appliances in OT networks where availability is paramount.
Verified Command/Configuration:
 Cisco IOS/XE Configuration
monitor session 1 source interface Gi1/0/1 both
monitor session 1 destination interface Gi1/0/24
! To monitor a VLAN instead of an interface:
monitor session 2 source vlan 100
monitor session 2 destination interface Gi1/0/24
! To apply an ACL that filters traffic (e.g., only MODBUS)
monitor session 1 filter packet-type good rx
monitor session 1 destination interface Gi1/0/24 encapsulation replicate
Step-by-Step Guide:
- Access your Cisco switch via SSH or console cable.
2. Enter global configuration mode: `configure terminal`
- The `monitor session 1 source interface Gi1/0/1 both` command defines a SPAN session (session 1) and sets the source interface (GigabitEthernet1/0/1) to mirror traffic in both transmit (Tx) and receive (Rx) directions.
- The `monitor session 1 destination interface Gi1/0/24` command designates the interface where your monitoring station or security appliance is connected. All copied traffic will be sent here.
- Use the `show monitor session all` command to verify your SPAN session is active and operational.
2. Capturing Traffic with tcpdump
Once the SPAN port is configured, you need to capture the mirrored traffic. `tcpdump` is a powerful, lightweight command-line packet analyzer that is the de facto standard for this task on Linux-based systems.
Verified Command/Configuration:
 Capture all traffic on interface eth0 and write to a file
sudo tcpdump -i eth0 -w ot_capture.pcap

Capture only MODBUS/TCP traffic (port 502)
sudo tcpdump -i eth0 -w modbus_traffic.pcap port 502

Capture traffic with a specific IP and a larger snapshot length for full packets
sudo tcpdump -i eth0 -s 0 -w full_packets.pcap host 192.168.1.10

Capture a limited number of packets for analysis
sudo tcpdump -i eth0 -c 1000 -w sample_capture.pcap
Step-by-Step Guide:
- Install tcpdump if necessary: `sudo apt-get install tcpdump`
2. Identify your network interface connected to the SPAN port using `ip a` orifconfig. Common interfaces areeth0,ens192, etc. - The `-i eth0` flag specifies the interface. The `-w ot_capture.pcap` flag writes the raw packets to a file for later analysis.
- Using filters like `port 502` (MODBUS) or `host 192.168.1.10` reduces capture file size and focuses on critical traffic.
- The `-s 0` flag sets the snapshot length to the default of 262144 bytes, ensuring you capture the full packet.
3. Analyzing PCAPs with Wireshark Command Line (tshark)
While Wireshark has a GUI, `tshark` provides its powerful dissection capabilities from the command line, which is ideal for automated analysis and servers.
Verified Command/Configuration:
 Read a PCAP and get a summary of conversations
tshark -r ot_capture.pcap -z conv,tcp

Follow a specific TCP stream (e.g., stream index 5)
tshark -r ot_capture.pcap -q -z follow,tcp,ascii,5

Export specific fields to JSON for SIEM ingestion (e.g., MODBUS function codes)
tshark -r ot_capture.pcap -T json -Y "modbus" -e ip.src -e ip.dst -e tcp.port -e modbus.func_code > modbus_events.json

Statistics on top talkers
tshark -r ot_capture.pcap -z endpoints,ip
Step-by-Step Guide:
- The `-r ot_capture.pcap` flag specifies the input file to read.
- The `-z conv,tcp` option generates a statistics report on TCP conversations, helping identify unusual data flows.
- The `follow,tcp,ascii,5` filter allows you to reconstruct and view the entire application-layer data exchange of a single TCP connection, which is invaluable for forensic analysis.
- The `-T json` output, combined with field extraction (
-e), transforms raw packets into structured data, creating a pipeline for your OT SIEM.
4. Hardening a Windows Collector Host
The machine connected to the SPAN port is a high-value target and must be secured. These Windows commands help disable non-essential services and audit logon activity.
Verified Command/Configuration:
:: Disable the SMBv1 protocol, a known security risk
PowerShell Disable-WindowsOptionalFeature -Online -FeatureName SMB1Protocol

:: Query for open ports on the local machine to identify unnecessary services
netstat -an | findstr "LISTENING"

:: Configure Windows Firewall to block all inbound traffic by default
netsh advfirewall set allprofiles firewallpolicy blockinbound,allowoutbound

:: Enable detailed audit logging for logon events
auditpol /set /category:"Logon/Logoff" /success:enable /failure:enable
Step-by-Step Guide:
1. Run Command Prompt or PowerShell as Administrator.
- The `Disable-WindowsOptionalFeature` PowerShell command removes the legacy and vulnerable SMBv1 client and server.
3. `netstat -an` lists all active network connections and listening ports. Investigate any unknown listening services. - The `netsh advfirewall` command sets a robust baseline firewall policy, blocking all unsolicited inbound connections while allowing the host to send data out to your SIEM.
5. `auditpol` ensures that all successful and failed logon attempts are recorded in the Windows Security log.
5. Leveraging Zeek (formerly Bro) for Protocol Analysis
Zeek is not a simple sniffer but a powerful network analysis framework. It interprets traffic and generates high-level, structured logs about the protocols it sees, making it ideal for OT environments.
Verified Command/Configuration:
 Basic Zeek run on an interface, generating log files in the current directory
zeek -i eth0 -C

Run a specific policy script to detect MODBUS traffic
zeek -i eth0 -C modbus.log

Monitor a PCAP file offline
zeek -r ot_capture.pcap modbus.log
After running, Zeek generates conn.log, dns.log, and potentially modbus.log.
Step-by-Step Guide:
- Install Zeek from your package manager or source.
- The `-i eth0` flag specifies the live capture interface. The `-C` flag ignores checksum errors, which can be common in mirrored traffic.
- Zeek will run in the foreground and create several `.log` files (e.g., `conn.log` for connection data, `http.log` for HTTP traffic). For OT, you would use specialized policy scripts like
modbus.log. - These log files are tab-separated and highly structured, making them perfect for direct ingestion into an OT SIEM like the one mentioned by Labshock.
6. Simulating OT Network Traffic for Testing
Testing your monitoring setup requires generating realistic OT traffic. Tools like `python-scapy` can be used to craft packets for common industrial protocols.
Verified Command/Configuration:
 Python script using Scapy to craft a MODBUS/TCP packet
from scapy.all import
from scapy.layers.inet import TCP, IP

Define source and destination
ip = IP(src="192.168.1.100", dst="192.168.1.10")
tcp = TCP(sport=502, dport=502, flags="PA")
 Simple MODBUS request (Read Holding Registers)
modbus = b'\x00\x01\x00\x00\x00\x06\x01\x03\x00\x6B\x00\x03'

Craft the full packet and send it
pkt = ip/tcp/modbus
send(pkt)
Step-by-Step Guide:
1. Install Scapy: `pip install scapy`
- This Python script constructs a packet from the layers up. The `IP()` layer sets the source and destination.
- The `TCP()` layer sets the source and destination port to 502, the standard for MODBUS/TCP, with the flags PSH-ACK (PA) indicating data payload.
- The `modbus` variable contains the raw bytes of a MODBUS Application Data Unit (ADU) for reading holding registers.
- The `send()` function transmits the packet on the network. Run this from a machine in your test lab and observe the traffic appearing in your SPAN capture and subsequent analysis tools.
What Undercode Say:
- The abstraction of raw packets into structured events is the single most critical data pipeline in modern OT security. Without it, you are flying blind.
- The fidelity of your mirroring configuration directly dictates the effectiveness of your entire security monitoring stack. A misconfigured SPAN port creates silent blind spots that adversaries can exploit.
The technical process outlined is not just academic; it’s the operational backbone of detection engineering. The shift from using host networking to true SPAN mirroring, as highlighted by Labshock, represents a maturation in security simulation, moving from convenience to realistic network representation. This realism is paramount for developing accurate threat detection logic. The commands provided are not mere examples but production-ready tools for security teams to deploy. The future of OT security lies in the deep, protocol-level understanding that only this kind of granular packet inspection can provide. Failing to master this data collection layer renders even the most advanced AI-driven SIEMs ineffective.
Prediction:
The increasing convergence of IT and OT networks will make SPAN-based monitoring an non-negotiable standard for all critical infrastructure within the next 3-5 years. Regulatory bodies will begin mandating not just the presence of an OT SIEM, but verifiable proof of deep packet inspection capabilities for core industrial protocols. Organizations that delay investing in these foundational visibility skills will face significant operational and compliance risks, potentially leading to catastrophic physical failures triggered by undetected cyber intrusions.
🎯Let’s Practice For Free:
IT/Security Reporter URL:
Reported By: Zakharb How – Hackers Feeds
Extra Hub: Undercode MoN
Basic Verification: Pass ✅


