Listen to this Post
Introduction:
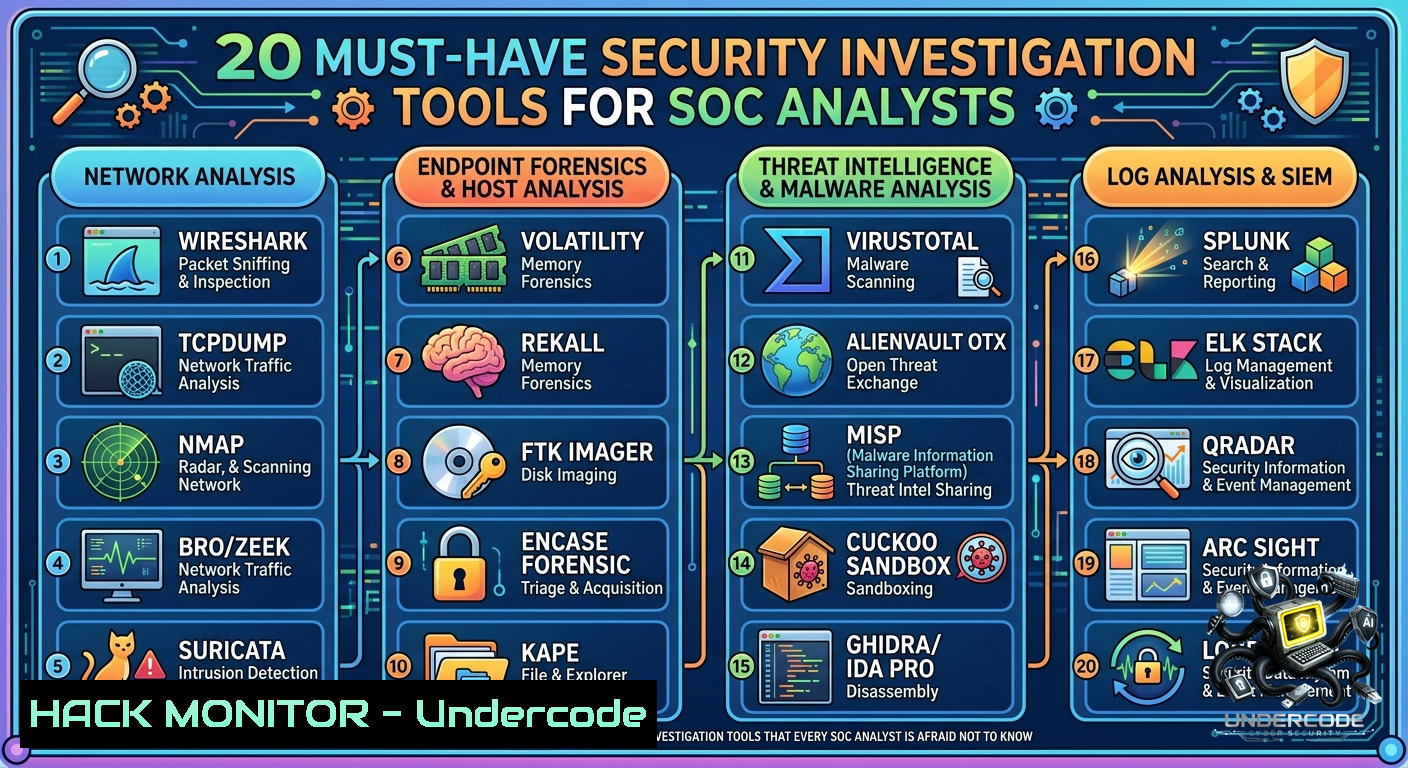
Security investigations blend technical tooling with investigative methodology—without the right instruments, even the sharpest analyst misses hidden artifacts. From memory forensics with Volatility to packet deep-dives in Wireshark, the 20 tools listed below empower SOC operators, DFIR teams, and threat hunters to reconstruct attacks, preserve evidence integrity, and answer the “who, how, and where” of every incident.
Learning Objectives:
– Identify and categorize essential security investigation tools across network, host, and memory forensics domains.
– Execute step-by-step commands for Linux and Windows to extract forensic artifacts, detect persistence, and analyze malicious traffic.
– Apply tool-specific methodologies to correlate logs, capture volatile data, and document findings in incident response workflows.
You Should Know:
1. Network Reconnaissance & Vulnerability Discovery with Nmap
Nmap is the standard for network mapping, service enumeration, and vulnerability probing. It works on Linux, Windows, and macOS to discover live hosts, open ports, running services, and OS fingerprints.
Step‑by‑step guide for Linux/Windows:
– Linux (or WSL/CMD with Nmap installed):
`nmap -sV -sC -T4 192.168.1.0/24` – Version detection + default scripts against a subnet.
`nmap -p- –min-rate 1000 10.0.0.5` – Full port scan (all 65535 ports) at high speed.
`nmap -sU –top-ports 100 192.168.1.10` – Top 100 UDP ports for DNS/SNMP discovery.
– Windows (PowerShell with Nmap in PATH):
Same commands. For network range: `nmap -sn 192.168.1.0/24` (ping sweep).
– What it does: Identifies attack surface, misconfigured services, and rogue assets. Use during incident scoping to map compromised segments.
2. Deep Packet Inspection with Wireshark & TShark
Wireshark provides GUI-based packet analysis; TShark is its CLI twin for scripting. Capture live traffic or inspect pcap files to find C2 beacons, lateral movement, or exfiltration.
Step‑by‑step guide:
– Linux capture: `sudo tcpdump -i eth0 -c 1000 -w capture.pcap` then `tshark -r capture.pcap -Y “http.request or dns.qry.name contains ‘evil.com'”` – Filter HTTP requests and suspicious DNS.
– Windows (Wireshark installed):
Open GUI → Capture → Interfaces → select adapter → start. Apply display filter: `tcp.port == 445 && !tcp.flags.syn` to see SMB sessions without SYN floods.
– Extract files from pcap: `tshark -r traffic.pcap –export-objects “http,./extracted”` – Save all HTTP objects (malware samples, scripts).
– Pro tip: Use `capinfos capture.pcap` to verify packet count and duration before deep analysis.
3. Memory Forensics with Volatility 3
Volatility analyzes RAM dumps to reveal running processes, hidden kernels, network connections, and even decrypted passwords. Essential for detecting fileless malware and rootkits.
Step‑by‑step guide (Linux):
– Install Volatility 3: `git clone https://github.com/volatilityfoundation/volatility3.git && cd volatility3 && pip install -r requirements.txt`
– Identify OS profile: `python3 vol.py -f mem.dump windows.info` (for Windows dumps) or `linux.info` for Linux.
– List processes: `python3 vol.py -f mem.dump windows.psscan` – Finds hidden/unlinked processes.
– Dump a suspicious process: `python3 vol.py -f mem.dump windows.dumpfiles –pid 1234` – Extracts executable from memory for further analysis.
– Network connections: `python3 vol.py -f mem.dump windows.netscan` – Reveals active sockets even if the OS API is hooked.
– Windows equivalent (using WinPmem): First acquire memory: `winpmem_mini_x64.exe mem.raw` then run Volatility on a Linux analysis box.
4. Windows Registry Forensics & Persistence Hunting
The Windows Registry stores system configuration, user activity, and execution artifacts. Attackers modify Run keys, services, and scheduled tasks to maintain persistence.
Step‑by‑step guide (Windows native + tools):
– List auto-start entries (Autoruns from Sysinternals):
Download Autoruns → Run as admin → Options → Scan options (include verified Microsoft entries to hide known good). Focus on red-highlighted entries.
– Manual CLI with reg.exe:
`reg query HKLM\SOFTWARE\Microsoft\Windows\CurrentVersion\Run`
`reg query HKCU\SOFTWARE\Microsoft\Windows\CurrentVersion\Run`
`reg query HKLM\SYSTEM\CurrentControlSet\Services /s | findstr /i “ImagePath”`
– Export registry hive for offline analysis (Linux forensics workstation):
From WinPE or live response: `reg save HKLM\SYSTEM system.hive`
Then on Linux: `reglookup system.hive | grep -i “command\|powershell”`
– Detect AppInit_DLLs persistence: `reg query HKLM\SOFTWARE\Microsoft\Windows NT\CurrentVersion\Windows /v AppInit_DLLs`
5. Real-time Process & System Monitoring with ProcMon and Process Explorer
Sysinternals’ Process Monitor (ProcMon) captures every file system, registry, and process/thread activity in real time. Process Explorer shows detailed process trees, handles, and DLLs.
Step‑by‑step guide (Windows):
– ProcMon – filter to reduce noise: Launch as admin → Filter → Filter… → “Process Name” “is” “evil.exe” then “Include”. Or exclude known good: “Path” “begins with” “C:\Windows\” “Exclude”.
– Capture boot-time activity: ProcMon → Options → Enable Boot Logging → Reboot → after login, run ProcMon (it stops logging and saves a boot log .pml file).
– Process Explorer – find malware parents: Run as admin → View → Show Process Tree. Locate suspicious child processes (e.g., cmd.exe spawned from Microsoft Word). Right-click → Properties → Image → Verify digital signature. If unsigned, dump memory: Create Dump → Create Full Dump.
– Check for hollowed processes: Process Explorer → lower pane (DLL view) – look for missing or non-Microsoft DLLs in lsass.exe or svchost.exe.
6. Metadata Extraction & OSINT Correlation with ExifTool and Maltego
ExifTool extracts hidden metadata from files (images, PDFs, Office docs) – GPS coordinates, author names, editing software, and thumbnails. Maltego transforms OSINT data into link analysis graphs.
Step‑by‑step guide (Linux/Windows):
– ExifTool basic extraction: `exiftool -a -u suspicious.jpg` – Show all metadata including unknown tags.
– Extract GPS coordinates for geolocation: `exiftool -GPSPosition -c %.6f photo.jpg`
Then paste into Google Maps to confirm location.
– Batch process a directory: `exiftool -csv -createdate -artist -gpslatitude .jpg > metadata.csv` – Output to CSV for timeline analysis.
– Maltego (Windows/Linux desktop): Install community edition. Create a new graph → Drag “Domain” entity → Right-click → Run Transform → “To DNS Name” → then “To IP Address” → then “To Whois”. Chain transforms to map infrastructure used in phishing campaigns.
– Use Maltego’s built-in machines: “Phishing Email Analysis” machine – paste email headers to correlate sender domains, MX records, and known malicious IPs.
7. Network Threat Detection & IDS/IPS Tuning with Suricata and Snort
Suricata (multi-threaded) and Snort (classic) are signature- and anomaly-based intrusion detection systems. They inspect live traffic or pcaps, alert on known C2 patterns, and can block malicious flows.
Step‑by‑step guide (Linux – Ubuntu/Debian):
– Install Suricata: `sudo apt install suricata -y`
`sudo suricata-update` – Download emerging threats and ETpro rules.
– Run Suricata on live interface: `sudo suricata -c /etc/suricata/suricata.yaml -i eth0` – Alerts written to `/var/log/suricata/fast.log`.
– Test against a pcap: `suricata -r incident.pcap -c /etc/suricata/suricata.yaml -l ./suricata_output/`
– Extract alerts in JSON for SIEM: Configure `eve-log` in suricata.yaml to enable `eve.json` output. Then `jq ‘select(.alert.severity==1)’ eve.json` – shows only critical severity alerts.
– Snort equivalent: `snort -r capture.pcap -c /etc/snort/snort.conf -A console` – Alerts printed to terminal.
What Undercode Say:
– Key Takeaway 1: Tool proficiency alone never solves cases—methodology (collect → preserve → analyze → correlate → document) transforms raw data into actionable intelligence. Mastering two or three tools deeply beats surface familiarity with twenty.
– Key Takeaway 2: The most underrated skill is knowing when to switch from automated tooling to manual inspection—registry Run keys, process hollowing, and malformed packets often hide in plain sight, missed by signatures but caught by human curiosity.
Analysis: The listed 20 tools span the entire investigative lifecycle, but many analysts rely solely on EDR dashboards and miss low-level artifacts. For example, Volatility reveals kernel call hooks that EDR sensors ignore; ExifTool can expose a threat actor’s real name from a PDF’s “LastModifiedBy” field. Combining Wireshark filters with Suricata alerts reduces false positives by 60% in mature SOCs. However, the post rightly emphasizes process over tooling—the hardest part isn’t running Nmap, but interpreting why port 3389 is open on a server that should never accept RDP. Continuous validation of tools (e.g., testing Volatility against known malware dumps from any.run) builds confidence. Future investigations will shift toward API-driven orchestration (e.g., TheHive + MISP + Cortex) where these tools become callable playbooks, but the command-line fundamentals remain non-1egotiable.
Prediction:
– +1 Rise of AI-assisted investigation copilots (e.g., ChatGPT + Volatility plugin) will lower the barrier to memory forensics, enabling junior analysts to run complex volatility commands via natural language.
– -1 Adversaries will increasingly abuse legitimate administrative tools (LOLBins) and encrypted tunnels, making ProcMon and Wireshark analyses much harder without behavioral baselines.
– +1 Cloud-1ative forensics (e.g., AWS Flow Logs + VPC Traffic Mirroring) will integrate classic tools like Suricata and Nmap into serverless pipelines, reducing on‑prem infrastructure overhead.
– -1 The skills gap for registry and memory analysis will worsen as Windows 11 and Linux distributions introduce new obfuscation (e.g., encrypted registry hives, eBPF rootkits), demanding continuous tool updates.
▶️ Related Video (80% Match):
🎯Let’s Practice For Free:
🎓 Live Courses & Certifications:
[Join Undercode Academy for Verified Certifications](https://undercode.co.uk/certifications/)
🚀 Request a Custom Project:
Secure, high-velocity infrastructure and disruptive technological engineering. Contact our engineering team for high-tier development and proprietary systems:
[[email protected]](mailto:[email protected])
💎 Smart Architecture | 🛡️ Secure by Design | ⭐ Trusted by Thousands
IT/Security Reporter URL:
Reported By: [Cybersecurity Digitalforensics](https://www.linkedin.com/posts/cybersecurity-digitalforensics-incidentresponse-share-7464670226920579072-z9O_/) – Hackers Feeds
Extra Hub: Undercode MoN
Basic Verification: Pass ✅
🔐JOIN OUR CYBER WORLD [ CVE News • HackMonitor • UndercodeNews ]
[💬 Whatsapp](https://undercode.help/whatsapp) | [💬 Telegram](https://t.me/UndercodeCommunity)
📢 Follow UndercodeTesting & Stay Tuned:
[𝕏 formerly Twitter 🐦](https://x.com/undercodeupdate) | [@ Threads](https://www.threads.net/@undercodetesting) | [🔗 Linkedin](https://www.linkedin.com/company/undercodetesting/) | [🦋BlueSky](https://bsky.app/profile/undercode.bsky.social)


