Listen to this Post
Introduction:
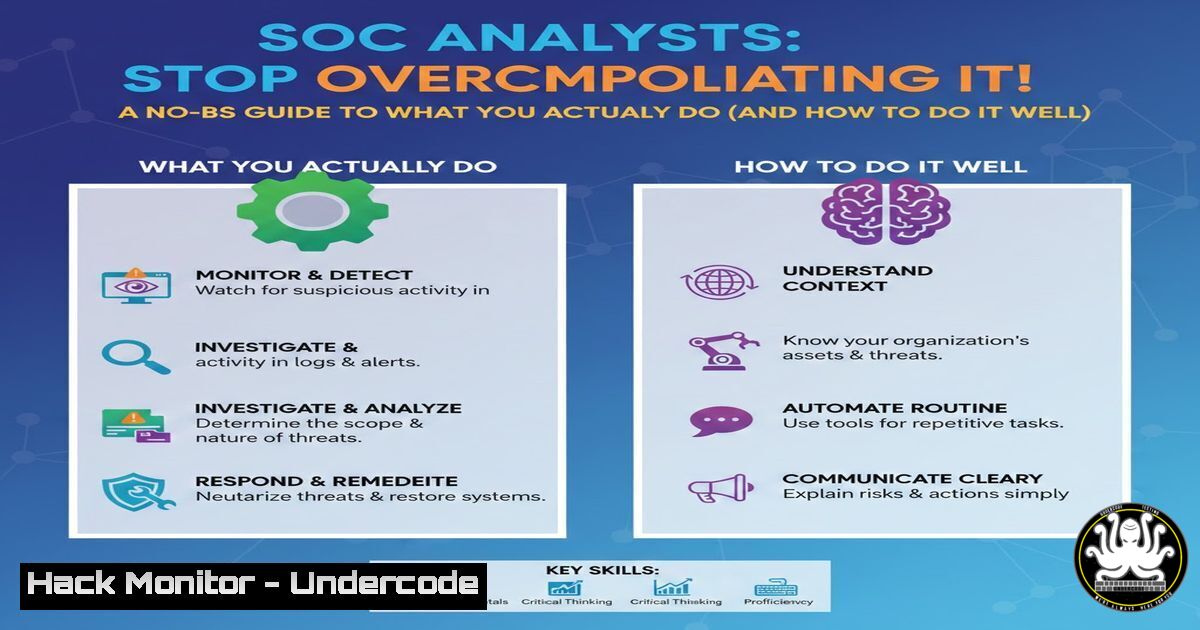
In a world saturated with complex cybersecurity buzzwords and advanced persistent threats, the core function of a Security Operations Center (SOC) Analyst often gets mystified. A recent industry meme humorously highlighted this, pointing out that some professionals “failed to RTFQ” (Read The Full Question) about where a SOC Analyst primarily works. The answer isn’t in a futuristic AI dashboard or a dark room full of holograms—it’s in the logs, the alerts, and the telemetry. This article cuts through the noise to define the real, tactical work of a SOC Analyst and provides the actionable technical guidance needed to excel at the fundamentals of detection, investigation, and response.
Learning Objectives:
- Understand the primary platforms and data sources a SOC Analyst interacts with daily.
- Master fundamental command-line and query techniques for log analysis on Windows and Linux systems.
- Develop a step-by-step methodology for triaging common security alerts and escalating incidents.
You Should Know:
- Your Primary Workspace: The SIEM Console and Endpoint Logs
The SOC Analyst’s true “office” is the Security Information and Event Management (SIEM) console and endpoint security platforms. Your primary task is to correlate data from these sources to separate true threats from false positives.
Step‑by‑step guide explaining what this does and how to use it.
1. Access Your SIEM: Log into platforms like Splunk, Elastic SIEM, or Microsoft Sentinel. Your dashboard presents aggregated alerts.
2. Understand the Data Source: Each alert is generated from logs. Common log sources include:
Windows Event Logs: (Security, System, PowerShell Operational)
Linux System Logs: (`/var/log/auth.log`, `/var/log/syslog`)
Firewall/Network Device Logs: (NetFlow, DNS query logs)
Endpoint Detection & Response (EDR) Telemetry: Process creation, network connections, file modifications.
3. Initial Triage Query: For a “Failed Login” alert, you must immediately query for context.
In Splunk SPL:
index=windows_security EventCode=4625
| stats count by user, source_ip_address, logon_type
| where count > 5
On a Linux Server (via SSH):
grep "Failed password" /var/log/auth.log | awk '{print $1,$2,$3,$9,$11}' | tail -20
On a Windows Server (via PowerShell):
Get-WinEvent -FilterHashtable @{LogName='Security'; ID=4625} -MaxEvents 10 | Select-Object TimeCreated, @{Name='TargetUser';Expression={$<em>.Properties[bash].Value}}, @{Name='SourceIP';Expression={$</em>.Properties[bash].Value}}
This initial query confirms the alert, identifies the targeted user and source IP, and helps determine if it’s a brute-force attack or a user error.
- The Art of the Investigation: Enriching and Connecting Dots
An alert in isolation is meaningless. The analyst’s skill is in enrichment—connecting the alert to other data to build a timeline and assess impact.
Step‑by‑step guide explaining what this does and how to use it.
1. Enrich the IP Address: Use internal and external tools to classify the source IP.
 Use whois or curl to passive APIs (be mindful of Terms of Service)
whois <IP_ADDRESS> | grep -i "country|netname"
curl -s https://ipapi.co/<IP_ADDRESS>/json/ | jq '.country_name, .asn'
2. Check Internal Context: Did the same user account log in successfully from elsewhere? Did the source IP communicate with other sensitive systems?
Example EDR Query (conceptual): “Show all process executions and network connections for host `HR-SERVER-01` in the 10 minutes before and after the failed login alert.”
3. Analyze Process Execution Chains: Use EDR data or Windows Security Event IDs 4688/1 (Sysmon) to see what happened after a potential compromise.
Critical Sysmon Event: A `cmd.exe` or `powershell.exe` spawned by an unexpected parent process (e.g., a document reader).
3. Mastering Your EDR Platform for Live Response
When evidence suggests an active threat, you must move from log analysis to live system interrogation using the EDR agent.
Step‑by‑step guide explaining what this does and how to use it.
1. Isolate the Host: Use the EDR’s containment function to block the host from network communication without shutting it down, preserving evidence.
2. Collect a Forensic Artifact Snapshot:
Running Processes: (Linux: ps auxf; Windows: tasklist /v)
Network Connections: (Linux: netstat -tunap; Windows: netstat -ano)
Persistence Locations: Check scheduled tasks, services, and startup folders.
 Windows - Get Scheduled Tasks created recently
Get-ScheduledTask | Where-Object {$_.DateCreated -gt (Get-Date).AddHours(-24)} | Format-List
 Linux - Check for cron jobs and systemd services
ls -la /etc/cron.d/ /etc/systemd/system/
3. Capture a Suspicious File: Use the EDR to pull a file from disk for sandbox analysis.
4. Writing Effective SIEM Detection Rules
To stop chasing false positives, analysts must provide feedback to improve detection logic. Understanding basic rule creation is key.
Step‑by‑step guide explaining what this does and how to use it.
1. Identify a True Positive Pattern: From your investigation, document the specific sequence. Example: “svchost.exe spawning `powershell.exe` with encoded command arguments is anomalous.”
2. Draft a Sigma Rule (Generic YAML): Sigma is a community standard for writing detection rules.
title: Suspect PowerShell Execution via SVCHOST
status: experimental
logsource:
product: windows
service: sysmon
detection:
selection:
EventID: 1
ParentImage: '\svchost.exe'
Image: '\powershell.exe'
filter:
CommandLine: '-EncodedCommand '
condition: selection and not filter
3. Collaborate with Engineers: Provide this Sigma rule to your SOC engineering team for conversion to your specific SIEM syntax (e.g., Splunk, QRadar).
5. The Critical Handoff: Escalation and Documentation
The final, crucial step is communicating your findings effectively to Incident Responders or Threat Hunters.
Step‑by‑step guide explaining what this does and how to use it.
1. Populate Your Incident Report (IR) Ticket: Use a standard format like TLP:WHITE
Executive Summary: 2-line description of the “what” and “so what.”
Timeline: Chronological list of key events with UTC timestamps.
Indicators of Compromise (IOCs): List IPs, hashes, filenames, registry keys in clear tables.
Affected Assets: List hostnames, IPs, and user accounts.
Action Taken: “Host contained via EDR at [bash]. Memory dump captured.”
Recommendation for Next Steps: “Request forensics team to analyze memory dump for credential harvesting malware.”
2. Conduct a Verbal Handoff: Brief the next analyst or responder team, highlighting the key evidence and immediate risks.
What Undercode Say:
- The Glamour is a Lie: The job isn’t about cinematic hacking. It’s about meticulous sifting through vast, often mundane, data streams to find the one deviant needle. Success is measured in reduced false positives and mean time to respond (MTTR), not flashy interfaces.
- Tool Mastery Over Tool Collection: Proficiency in writing a precise `grep` command or crafting a efficient SIEM query is infinitely more valuable than a superficial familiarity with dozens of platforms. Depth in your primary tools trumps breadth every time.
The meme’s core truth is that the industry often forgets the foundational, gritty work of cybersecurity in favor of marketing the “next big thing.” A SOC Analyst’s power doesn’t come from the tool’s UI, but from their analytical rigor and systematic approach applied through that tool. The future SOC will be defined not by replacing this analyst, but by arming them with better AI-assisted query builders and automation to handle the repetitive tasks, freeing them to focus on the complex analytical reasoning that machines cannot replicate.
Prediction:
Within the next 2-3 years, the SOC Analyst role will bifurcate. The “Tier 1” function will be heavily augmented by AI co-pilots that auto-triage low-fidelity alerts and suggest investigation queries. However, this will create an even greater demand and higher value for the investigative analyst—the professional who can interpret the AI’s output, challenge its assumptions, and lead the hands-on investigation for sophisticated incidents that evade automated detection. The fundamentals of log analysis, host forensics, and threat modeling will become more critical, not less, as they become the differentiator between a fully automated SOC and a strategically effective one.
▶️ Related Video (70% Match):
🎯Let’s Practice For Free:
IT/Security Reporter URL:
Reported By: Brysonbort Where – Hackers Feeds
Extra Hub: Undercode MoN
Basic Verification: Pass ✅


